
| Procedure | Electrocardiogram (ECG) v1 | ||
|---|---|---|---|
| Pipeline | IMPC_adult_v2-LaterOnset | Screen Age (week) | 12-52w |
| Parameter | QT interval | ||
| Strain | Condition 1 | Pipeline(s) | Tested Day (Age) |
|---|---|---|---|
| IMPC_adult_v2-LaterOnset | |||
| C57BL/6NJcl | Late | ♀: 4 ♂: 4 |
2015/10/27 - 2016/08/02 (12.64 - 52.79) |
| Early | ♀: 5 ♂: 5 |
| Factor | df | Bartlett's K2 | p |
|---|---|---|---|
| condition1 | 1 | 1.115139 | 0.2909676 |
| sex | 1 | 3.032867 | 0.08159374 |
| Factor | mean | median | SD | SEM | N |
|---|---|---|---|---|---|
| condition1 - sex | |||||
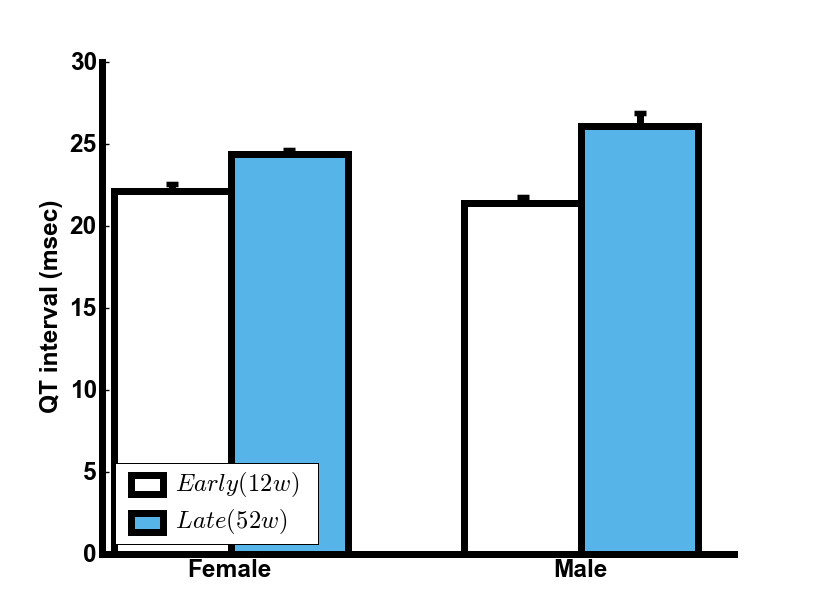
| Early(12w) - Female | 22.12 | 22.03 | 1.09 | 0.49 | 5 |
| Early(12w) - Male | 21.37 | 21.02 | 0.94 | 0.42 | 5 |
| Late(52w) - Female | 24.39 | 24.34 | 0.43 | 0.22 | 4 |
| Late(52w) - Male | 26.04 | 25.93 | 1.85 | 0.93 | 4 |
| Signif. codes ***: <0.001 **: <0.010 *: <0.050 †: <0.100 |
||||||
| Factor | df | Sum Sq. | F value | Pr(>F) | Signif. | |
|---|---|---|---|---|---|---|
| condition1 | 1 | 53.484 | 39.0436 | 2.132e-05 | *** | |
| sex | 1 | 0.461 | 0.3364 | 0.57114 | ||
| condition1:sex | 1 | 6.416 | 4.6837 | 0.04822 | * | |
| Residuals | 14 | 19.178 | ||||
| Level | Difference | Lower | Upper | Adjusted p |
|---|---|---|---|---|
| Late(52w) - Early(12w) | 3.47 | 2.28 | 4.66 | 2.13e-05 |
| Level | Difference | Lower | Upper | Adjusted p |
|---|---|---|---|---|
| Late(52w):Female - Early(12w):Female | 2.267 | -0.0145 | 4.550 | 0.051725 |
| Early(12w):Male - Early(12w):Female | -0.748 | -2.8995 | 1.404 | 0.746085 |
| Late(52w):Male - Early(12w):Female | 3.922 | 1.6405 | 6.205 | 0.000995 |
| Early(12w):Male - Late(52w):Female | -3.015 | -5.2975 | -0.733 | 0.008624 |
| Late(52w):Male - Late(52w):Female | 1.655 | -0.7505 | 4.060 | 0.234284 |
| Late(52w):Male - Early(12w):Male | 4.671 | 2.3885 | 6.953 | 0.000185 |
| comment |
|---|
| QT interval was significantly increased in 52-week-old mice (Late) relative to 12-week-old mice (Early) (p<0.01) in only male. |