| Procedure | Body Composition (DEXA lean/fat) v1 | ||
|---|---|---|---|
| Pipeline | IMPC_adult_v2-LaterOnset | Screen Age (week) | 14-54w |
| Parameter | Body weight | ||
| Strain | Condition 1 | Pipeline(s) | Tested Day (Age) |
|---|---|---|---|
| IMPC_adult_v2-LaterOnset | |||
| C57BL/6NJcl | Late | ♀: 11 ♂: 9 |
2015/11/11 - 2016/08/15 (14.5 - 54.79) |
| Early | ♀: 14 ♂: 13 |
| Factor | df | Bartlett's K2 | p |
|---|---|---|---|
| condition1 | 1 | 13.11439 | 0.0002930359 |
| sex | 1 | 0.8222301 | 0.3645289 |
| Factor | mean | median | SD | SEM | N |
|---|---|---|---|---|---|
| condition1 - sex | |||||
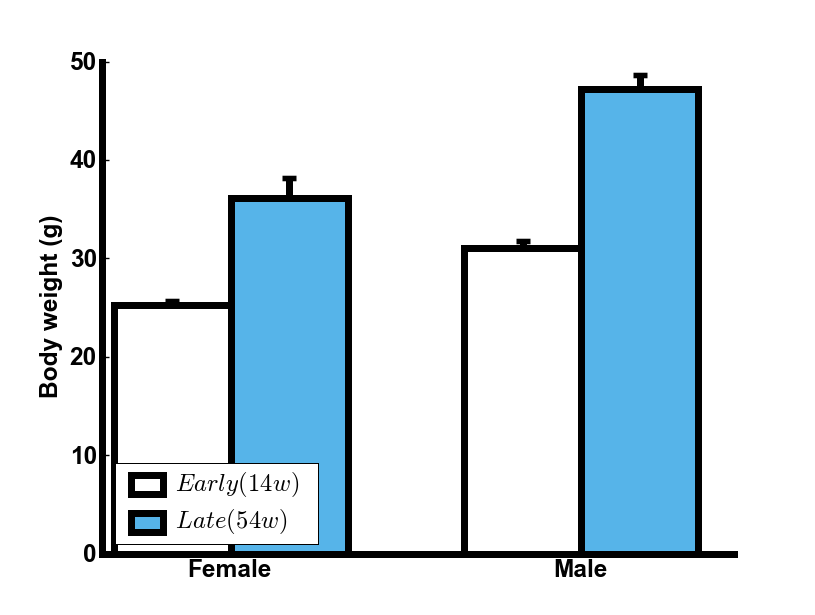
| Early(14w) - Female | 25.21 | 24.8 | 1.89 | 0.51 | 14 |
| Early(14w) - Male | 31.05 | 31.6 | 2.69 | 0.74 | 13 |
| Late(54w) - Female | 36.09 | 33.1 | 7.08 | 2.13 | 11 |
| Late(54w) - Male | 47.18 | 49.4 | 4.68 | 1.56 | 9 |
| Signif. codes ***: <0.001 **: <0.010 *: <0.050 †: <0.100 |
||||||
| Factor | df | Sum Sq. | F value | Pr(>F) | Signif. | |
|---|---|---|---|---|---|---|
| condition1 | 1 | 2035.04 | 108.0960 | 2.613e-13 | *** | |
| sex | 1 | 759.66 | 40.3515 | 1.123e-07 | *** | |
| condition1:sex | 1 | 78.60 | 4.1752 | 0.04718 | * | |
| Residuals | 43 | 809.53 | ||||
| Level | Difference | Lower | Upper | Adjusted p |
|---|---|---|---|---|
| Late(54w) - Early(14w) | 13.1 | 10.5 | 15.6 | 1.59e-12 |
| Level | Difference | Lower | Upper | Adjusted p |
|---|---|---|---|---|
| Male - Female | 8.05 | 5.5 | 10.6 | 1.13e-07 |
| Level | Difference | Lower | Upper | Adjusted p |
|---|---|---|---|---|
| Late(54w):Female - Early(14w):Female | 10.88 | 6.21 | 15.556 | 1.01e-06 |
| Early(14w):Male - Early(14w):Female | 5.84 | 1.37 | 10.305 | 5.92e-03 |
| Late(54w):Male - Early(14w):Female | 21.97 | 17.02 | 26.925 | 1.14e-12 |
| Early(14w):Male - Late(54w):Female | -5.04 | -9.80 | -0.294 | 3.36e-02 |
| Late(54w):Male - Late(54w):Female | 11.09 | 5.88 | 16.299 | 6.13e-06 |
| Late(54w):Male - Early(14w):Male | 16.13 | 11.10 | 21.160 | 4.43e-10 |
| comment |
|---|
| Body weight was significantly increased in 54-week-old mice (Late) relative to 14-week-old mice (Early)(p<0.001). |