Conditions of statistics.
Pearson's chi-square test
| Chi-square |
df |
p |
| 0.36 |
1 |
0.5485 |
Observed value
| |
Head morphology |
| 0 |
| condition1 |
Early(9w) |
14.0
|
| Late(49w) |
11.0
|
Expected value
| |
Head morphology |
| 0 |
| condition1 |
Early(9w) |
12.5
|
| Late(49w) |
12.5
|
Standarized residuals
| |
Head morphology |
| 0 |
| condition1 |
Early(9w) |
0.4242641
|
| Late(49w) |
-0.4242641
|
Adjusted residuals
| |
Head morphology |
| 0 |
| condition1 |
Early(9w) |
Inf
|
| Late(49w) |
-Inf
|
p of adjustment residual analysis
| |
Head morphology |
| 0 |
| condition1 |
Early(9w) |
1.0
|
| Late(49w) |
0.0
|
|
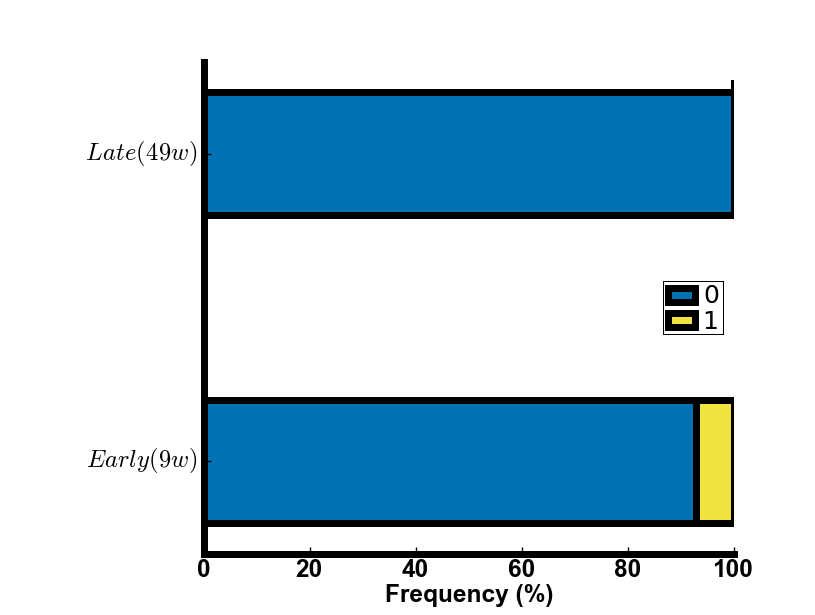
Conditions of statistics.
Pearson's chi-square test
| Chi-square |
df |
p |
| 0.6721 |
1 |
0.4123 |
Observed value
| |
Head morphology |
| 0 |
1 |
| condition1 |
Early(9w) |
13.0
| 1.0
|
| Late(49w) |
9.0
| 0.0
|
Expected value
| |
Head morphology |
| 0 |
1 |
| condition1 |
Early(9w) |
13.391304
| 0.6086957
|
| Late(49w) |
8.608696
| 0.3913043
|
Standarized residuals
| |
Head morphology |
| 0 |
1 |
| condition1 |
Early(9w) |
-0.1069309
| 0.5015504
|
| Late(49w) |
0.1333663
| -0.6255432
|
Adjusted residuals
| |
Head morphology |
| 0 |
1 |
| condition1 |
Early(9w) |
-0.8198036
| 0.8198036
|
| Late(49w) |
0.8198036
| -0.8198036
|
p of adjustment residual analysis
| |
Head morphology |
| 0 |
1 |
| condition1 |
Early(9w) |
0.206164
| 0.793836
|
| Late(49w) |
0.793836
| 0.206164
|
|