
| Procedure | Combined SHIRPA and Dysmorphology v1.1 | ||
|---|---|---|---|
| Pipeline | IMPC_adult_v2-LaterOnset | Screen Age (week) | 9-49w |
| Parameter Group | Body size | ||
| Parameter | Body weight | ||
| Strain | Condition 1 | Pipeline(s) | Tested Day (Age) |
|---|---|---|---|
| IMPC_adult_v2-LaterOnset | |||
| C57BL/6NJcl | Late | ♀: 11 ♂: 9 |
2015/10/06 - 2016/07/12 (9.36 - 49.93) |
| Early | ♀: 14 ♂: 13 |
| Factor | df | Bartlett's K2 | p |
|---|---|---|---|
| condition1 | 1 | 24.74737 | 6.535789e-07 |
| sex | 1 | 1.247820 | 0.2639693 |
| Factor | mean | median | SD | SEM | N |
|---|---|---|---|---|---|
| condition1 - sex | |||||
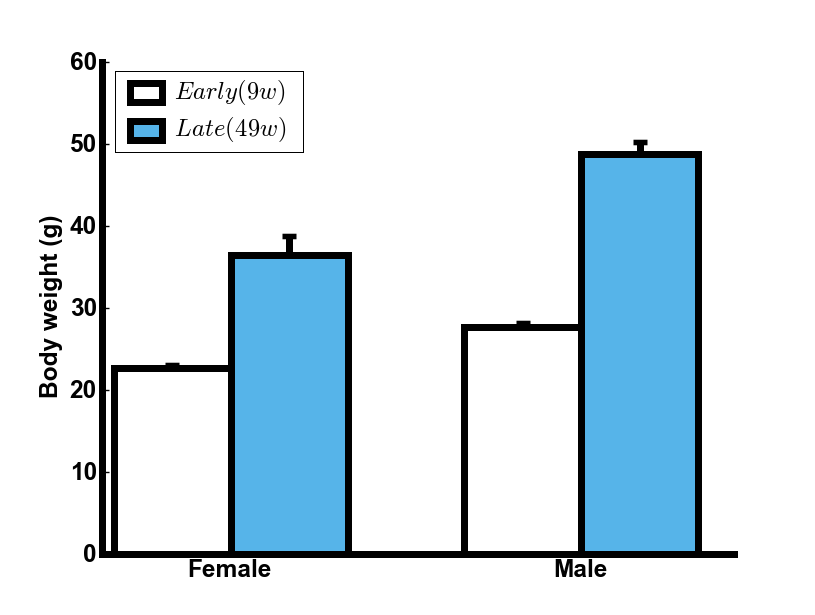
| Early(9w) - Female | 22.59 | 22.1 | 1.33 | 0.35 | 14 |
| Early(9w) - Male | 27.58 | 28 | 1.87 | 0.52 | 13 |
| Late(49w) - Female | 36.42 | 32.8 | 8.02 | 2.42 | 11 |
| Late(49w) - Male | 48.68 | 51.2 | 4.92 | 1.64 | 9 |
| Signif. codes ***: <0.001 **: <0.010 *: <0.050 †: <0.100 |
||||||
| Factor | df | Sum Sq. | F value | Pr(>F) | Signif. | |
|---|---|---|---|---|---|---|
| condition1 | 1 | 3394.3 | 161.6990 | 3.331e-16 | *** | |
| sex | 1 | 762.0 | 36.2978 | 3.365e-07 | *** | |
| condition1:sex | 1 | 150.5 | 7.1677 | 0.01047 | * | |
| Residuals | 43 | 902.6 | ||||
| Level | Difference | Lower | Upper | Adjusted p |
|---|---|---|---|---|
| Late(49w) - Early(9w) | 16.9 | 14.2 | 19.7 | 1.11e-12 |
| Level | Difference | Lower | Upper | Adjusted p |
|---|---|---|---|---|
| Male - Female | 8.07 | 5.36 | 10.8 | 3.4e-07 |
| Level | Difference | Lower | Upper | Adjusted p |
|---|---|---|---|---|
| Late(49w):Female - Early(9w):Female | 13.83 | 8.899 | 18.77 | 1.49e-08 |
| Early(9w):Male - Early(9w):Female | 5.00 | 0.283 | 9.71 | 3.40e-02 |
| Late(49w):Male - Early(9w):Female | 26.09 | 20.861 | 31.32 | 1.11e-12 |
| Early(9w):Male - Late(49w):Female | -8.83 | -13.850 | -3.82 | 1.50e-04 |
| Late(49w):Male - Late(49w):Female | 12.26 | 6.756 | 17.76 | 2.51e-06 |
| Late(49w):Male - Early(9w):Male | 21.09 | 15.784 | 26.40 | 1.94e-12 |
| comment |
|---|
| Body weight was significantly increased in 49-week-old mice (Late) relative to 9-week-old mice (Early) in both sexes (p<0.01). |