
| Procedure | Combined SHIRPA and Dysmorphology v1.1 | ||
|---|---|---|---|
| Pipeline | IMPC_adult_v2-LaterOnset | Screen Age (week) | 9-49w |
| Parameter Group | Body size | ||
| Parameter | Body mass index (BMI) | ||
| Strain | Condition 1 | Pipeline(s) | Tested Day (Age) |
|---|---|---|---|
| IMPC_adult_v2-LaterOnset | |||
| C57BL/6NJcl | Late | ♀: 11 ♂: 9 |
2015/10/06 - 2016/07/12 (9.36 - 49.93) |
| Early | ♀: 14 ♂: 13 |
| Factor | df | Bartlett's K2 | p |
|---|---|---|---|
| condition1 | 1 | 28.2223 | 1.081514e-07 |
| sex | 1 | 0.873847 | 0.3498925 |
| Factor | mean | median | SD | SEM | N |
|---|---|---|---|---|---|
| condition1 - sex | |||||
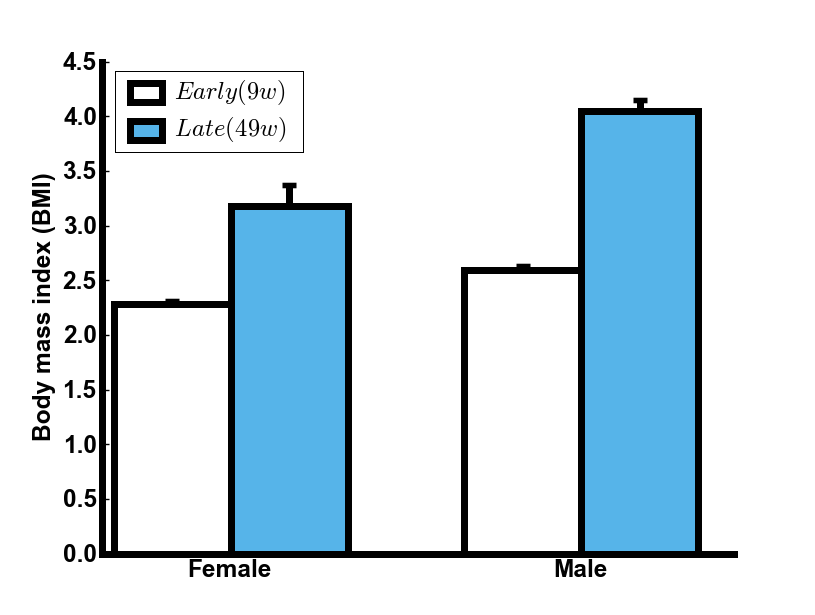
| Early(9w) - Female | 2.28 | 2.27 | 0.11 | 0.03 | 14 |
| Early(9w) - Male | 2.59 | 2.6 | 0.15 | 0.04 | 13 |
| Late(49w) - Female | 3.18 | 2.86 | 0.66 | 0.2 | 11 |
| Late(49w) - Male | 4.05 | 4.18 | 0.32 | 0.11 | 9 |
| Signif. codes ***: <0.001 **: <0.010 *: <0.050 †: <0.100 |
||||||
| Factor | df | Sum Sq. | F value | Pr(>F) | Signif. | |
|---|---|---|---|---|---|---|
| condition1 | 1 | 15.3910 | 119.4258 | 5.451e-14 | *** | |
| sex | 1 | 3.5594 | 27.6192 | 4.368e-06 | *** | |
| condition1:sex | 1 | 0.8753 | 6.7922 | 0.01253 | * | |
| Residuals | 43 | 5.5416 | ||||
| Level | Difference | Lower | Upper | Adjusted p |
|---|---|---|---|---|
| Late(49w) - Early(9w) | 1.14 | 0.927 | 1.35 | 1.21e-12 |
| Level | Difference | Lower | Upper | Adjusted p |
|---|---|---|---|---|
| Male - Female | 0.551 | 0.340 | 0.763 | 4.41e-06 |
| Level | Difference | Lower | Upper | Adjusted p |
|---|---|---|---|---|
| Late(49w):Female - Early(9w):Female | 0.901 | 0.5148 | 1.288 | 9.90e-07 |
| Early(9w):Male - Early(9w):Female | 0.317 | -0.0522 | 0.687 | 1.15e-01 |
| Late(49w):Male - Early(9w):Female | 1.772 | 1.3626 | 2.182 | 1.17e-12 |
| Early(9w):Male - Late(49w):Female | -0.584 | -0.9771 | -0.191 | 1.48e-03 |
| Late(49w):Male - Late(49w):Female | 0.871 | 0.4399 | 1.302 | 1.58e-05 |
| Late(49w):Male - Early(9w):Male | 1.455 | 1.0392 | 1.871 | 3.94e-11 |
| comment |
|---|
| BMI was significantly increased in 49-week-old mice (Late) relative to 9-week-old mice (Early) in both sexes (p<0.01). |