| Procedure | Intraperitoneal glucose tolerance test (IPGTT) | ||
|---|---|---|---|
| Pipeline | IMPC_adult_v2-LaterOnset | Screen Age (week) | 13-53w |
| Parameter | Blood glucose concentration | ||
| Strain | Condition 1 | Pipeline(s) | Tested Day (Age) |
|---|---|---|---|
| IMPC_adult_v2-LaterOnset | |||
| C57BL/6NJcl | Late | ♀: 7 ♂: 7 |
2015/11/05 - 2016/08/09 (13.64 - 53.93) |
| Early | ♀: 14 ♂: 13 |
Conditions of statistics.
Pairwise comparisons using t tests with pooled SD
|
|||||||||||||||||||||||||||||||||||||||||||||||||||||||||||||||||||||||||||||||||||||||||||||||||||||||||||||||||||||||||||||||||||||||||||||||||||||||||||||||||||||||||||||||||||||||||||||||||||||||||||||||||||||||||||||||||||||||||||||||||||||||||||||||||||||||||||||||||||||||||||||||||||||||||||||||||||||||||||||||||||||||||||||||||||||||||||||||||||||
| Pair | p |
|---|---|
| 0 - 15 | 0 |
| 0 - 30 | 0 |
| 0 - 60 | 0 |
| 15 - 60 | 0 |
| 15 - 120 | 0 |
| 30 - 60 | 0 |
| 30 - 120 | 0 |
| 60 - 120 | 0 |
Conditions of statistics.
| sex | Male |
|---|
| Factor | df | Bartlett's K2 | p |
|---|---|---|---|
| condition1 | 1 | 1.843646 | 0.1745243 |
| within | 4 | 44.67693 | 4.640888e-09 |
| Factor | Mauchly's W | p |
|---|
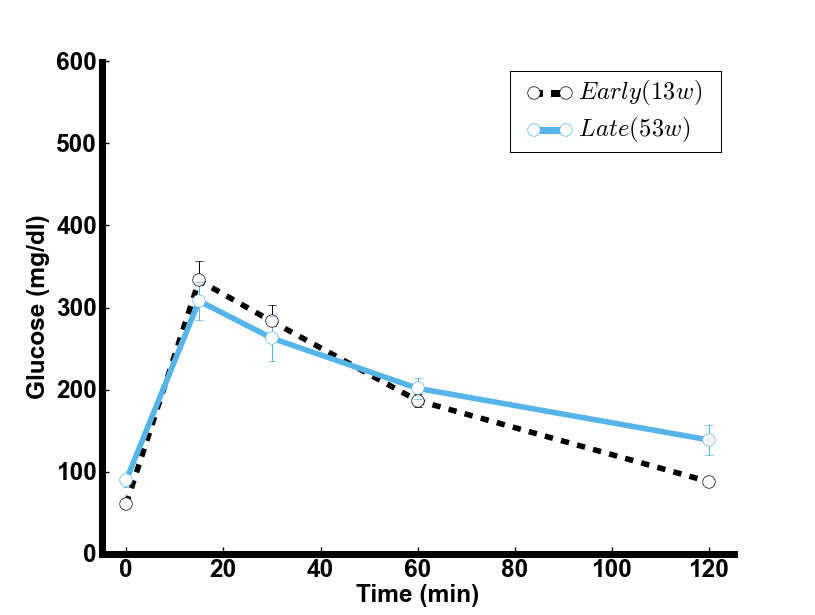
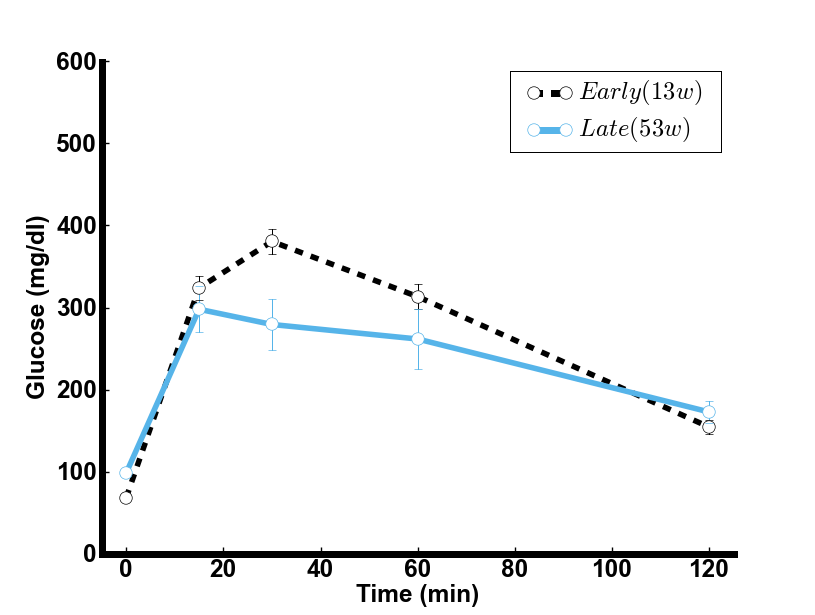
| Factor | mean | median | SD | SEM | N |
|---|---|---|---|---|---|
| condition1 - within | |||||
| Early(13w) - 0 | 67.92 | 67 | 10.14 | 2.81 | 13 |
| Early(13w) - 15 | 323.92 | 325 | 56.65 | 15.71 | 13 |
| Early(13w) - 30 | 380.54 | 386 | 56.08 | 15.55 | 13 |
| Early(13w) - 60 | 313.23 | 307 | 58.68 | 16.28 | 13 |
| Early(13w) - 120 | 154.15 | 152 | 33.52 | 9.3 | 13 |
| Late(53w) - 0 | 98.14 | 97 | 8.73 | 3.3 | 7 |
| Late(53w) - 15 | 297.86 | 298 | 80.95 | 30.6 | 7 |
| Late(53w) - 30 | 279.29 | 240 | 87.7 | 33.15 | 7 |
| Late(53w) - 60 | 261.57 | 217 | 104.11 | 39.35 | 7 |
| Late(53w) - 120 | 172.57 | 191 | 38.34 | 14.49 | 7 |
| Signif. codes ***: <0.001 **: <0.010 *: <0.050 †: <0.100 |
||||||
| Factor | df | Sum Sq. | Mean Sq. | F value | Pr(>F) | Signif. |
|---|---|---|---|---|---|---|
| condition1 | 1 | 15460 | 15460 | 1.6104 | 0.2206 | |
| Residuals | 18 | 172795 | 9600 | |||
| within | 4 | 1041247 | 260312 | 157.1345 | 2.2e-16 | *** |
| condition1:within | 4 | 52120 | 13030 | 7.8654 | 2.565e-05 | *** |
| Residuals | 72 | 119276 | 1657 | |||
Pairwise comparisons using t tests with pooled SD
P value adjust method : Bonferroni
| Pair | p |
|---|---|
| 0 - 15 | 0 |
| 0 - 30 | 0 |
| 0 - 60 | 0 |
| 0 - 120 | 6e-04 |
| 15 - 120 | 0 |
| 30 - 120 | 0 |
| 60 - 120 | 0 |
| Pair | p |
|---|---|
| Early(13w):0 - Early(13w):120 | 0.0096 |
| Early(13w):0 - Early(13w):15 | 0 |
| Early(13w):0 - Early(13w):30 | 0 |
| Early(13w):0 - Early(13w):60 | 0 |
| Early(13w):0 - Late(53w):120 | 0.0078 |
| Early(13w):0 - Late(53w):15 | 0 |
| Early(13w):0 - Late(53w):30 | 0 |
| Early(13w):0 - Late(53w):60 | 0 |
| Early(13w):120 - Early(13w):15 | 0 |
| Early(13w):120 - Early(13w):30 | 0 |
| Early(13w):120 - Early(13w):60 | 0 |
| Early(13w):120 - Late(53w):15 | 0 |
| Early(13w):120 - Late(53w):30 | 4e-04 |
| Early(13w):120 - Late(53w):60 | 0.0054 |
| Early(13w):15 - Late(53w):0 | 0 |
| Early(13w):15 - Late(53w):120 | 0 |
| Early(13w):30 - Late(53w):0 | 0 |
| Early(13w):30 - Late(53w):120 | 0 |
| Early(13w):30 - Late(53w):30 | 0.0122 |
| Early(13w):30 - Late(53w):60 | 0.0011 |
| Early(13w):60 - Late(53w):0 | 0 |
| Early(13w):60 - Late(53w):120 | 0 |
| Late(53w):0 - Late(53w):15 | 0 |
| Late(53w):0 - Late(53w):30 | 0 |
| Late(53w):0 - Late(53w):60 | 0 |
| Late(53w):120 - Late(53w):15 | 0.0039 |
| Late(53w):120 - Late(53w):30 | 0.0322 |
|
|
| comment |
|---|
| Blood glucose concentration (30 min) was significantly decreased in 53-week-old mice (Late) relative to 13-week-old mice (Early) (p<0.05) in only male. |