
| Procedure | Intraperitoneal glucose tolerance test (IPGTT) | ||
|---|---|---|---|
| Pipeline | IMPC_adult_v2-LaterOnset | Screen Age (week) | 13-53w |
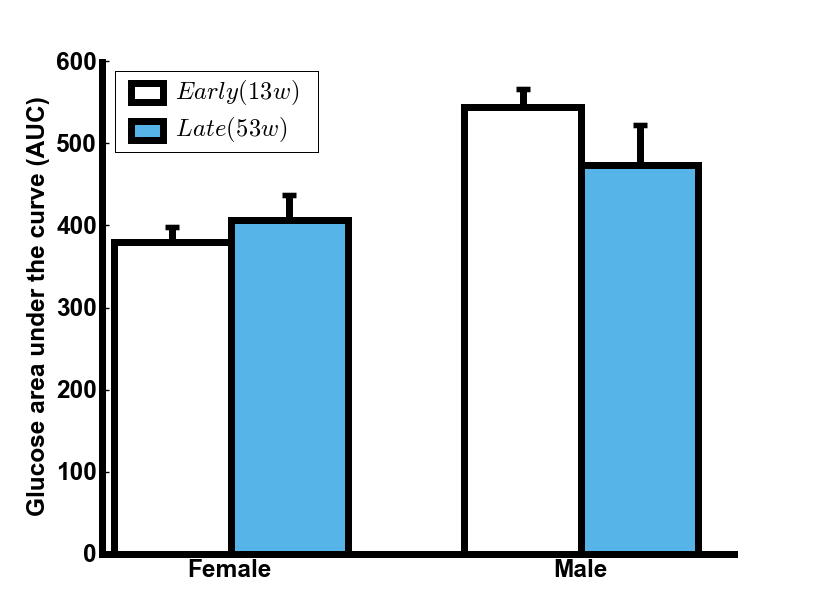
| Parameter | Glucose area under the curve (AUC) | ||
| Strain | Condition 1 | Pipeline(s) | Tested Day (Age) |
|---|---|---|---|
| IMPC_adult_v2-LaterOnset | |||
| C57BL/6NJcl | Late | ♀: 7 ♂: 7 |
2015/11/05 - 2016/08/09 (13.64 - 53.93) |
| Early | ♀: 14 ♂: 13 |
| Factor | df | Bartlett's K2 | p |
|---|---|---|---|
| condition1 | 1 | 0.01902907 | 0.8902832 |
| sex | 1 | 2.804253 | 0.09401462 |
| Factor | mean | median | SD | SEM | N |
|---|---|---|---|---|---|
| condition1 - sex | |||||
| Early(13w) - Female | 380.48 | 385.7 | 68.09 | 18.2 | 14 |
| Early(13w) - Male | 544.19 | 532.6 | 85.29 | 23.65 | 13 |
| Late(53w) - Female | 406.93 | 446.6 | 86.79 | 32.81 | 7 |
| Late(53w) - Male | 473.96 | 411.4 | 138.18 | 52.23 | 7 |
| Signif. codes ***: <0.001 **: <0.010 *: <0.050 †: <0.100 |
||||||
| Factor | df | Sum Sq. | F value | Pr(>F) | Signif. | |
|---|---|---|---|---|---|---|
| condition1 | 1 | 4174 | 0.5025 | 0.4828 | ||
| sex | 1 | 174856 | 21.0515 | 4.995e-05 | *** | |
| condition1:sex | 1 | 21536 | 2.5928 | 0.1159 | ||
| Residuals | 37 | 307326 | ||||
| Level | Difference | Lower | Upper | Adjusted p |
|---|---|---|---|---|
| Male - Female | 131 | 73 | 188 | 5.01e-05 |
| comment |
|---|
| Any significant difference was not detected in age. |